Tips for Graph Viewer
Determining resistance from I-V test results
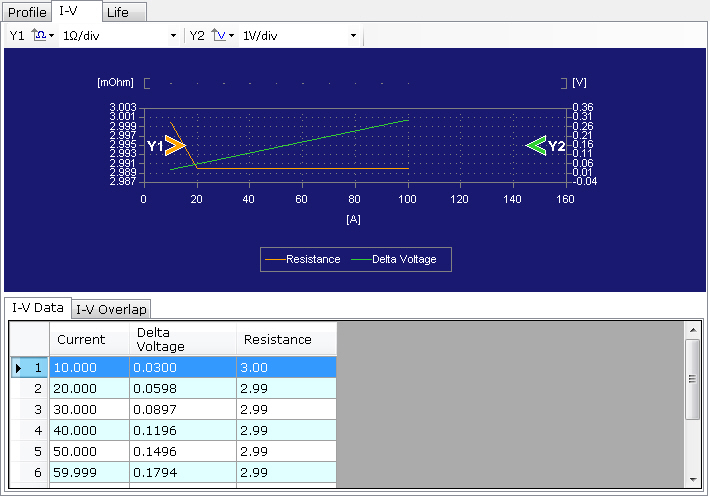
I-V characteristic graphs are generated based on the measurement results of battery voltage and charge/discharge current when the charge/discharge current is varied in step increments.
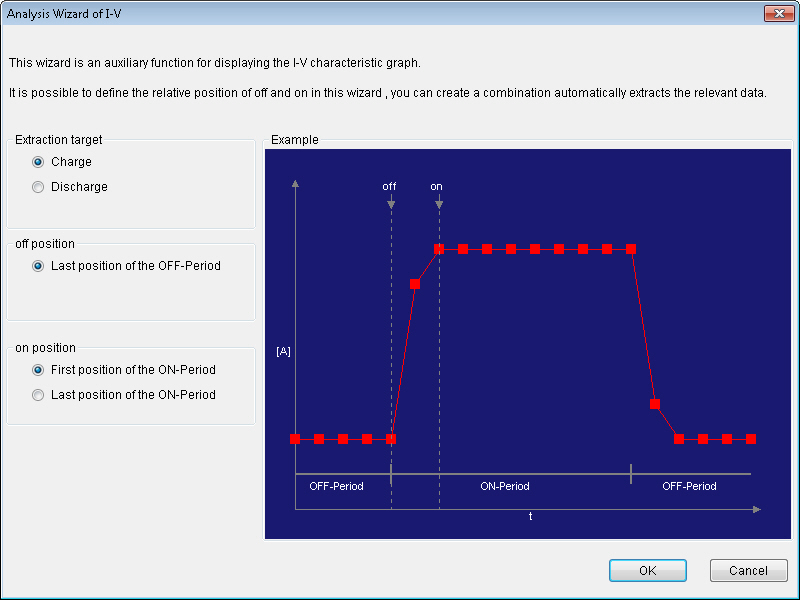
There are two methods to create an I-V graph. One method is to use a wizard to extract relevant data and create the graph automatically. The other method is to set sampling number (standard measurement data number) points one by one to create the graph.
The automatic generation of I-V characteristic graph is valid if steps are automatically configured when an I-V characteristic profile is created on Test Condition Editor. If an I-V characteristic graph is created automatically from the measurement results of an I-V characteristic profile whose steps have not been configured automatically, a correct graph will not be displayed.
This section explains an example of creating an I-V characteristic graph using the wizard.
- On the Profile tab, display the profile that you want to analyze the I-V characteristic of.
- Click the I-V tab.
- From the Data menu, select Analysis of I-V.
- Enter the name for the setting conditions.
- Click

- Click OK.
An Analysis of I-V window appears.

The I-V characteristic name is used when displaying overlapped graphs. This time enter any name of your choice.
An Analysis Wizard of I-V window appears.
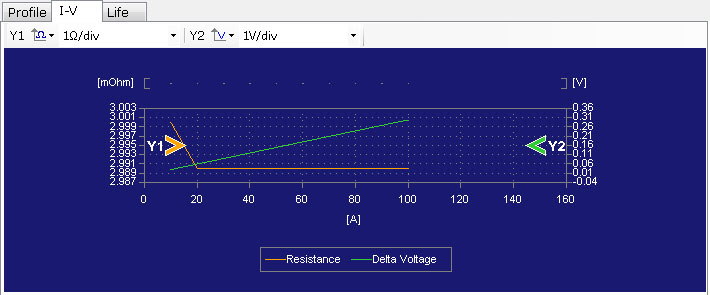
The I-V characteristic graph appears. The text area also displays resistance values.