Tips for Graph Viewer
Zooming graphs
You can zoom graphs on the Graph Viewer. This is effective such as when you want to view in detail the voltage waveform at the end of charging.
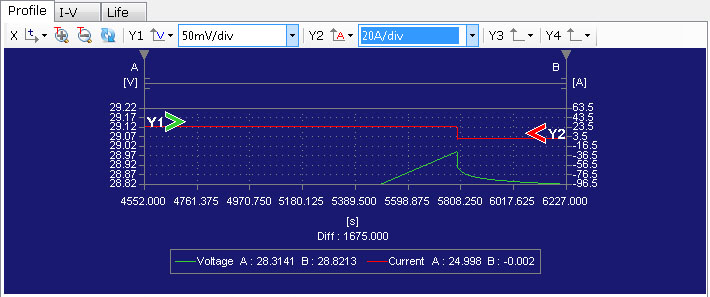
Expanding and reducing the X-axis
You can move cursors A and B by dragging. Cursors A and B snap to the standard measurement
data. You can only select points in the standard measurement data.
Clicking ![]() displays the area specified by cursors A and B fully in the horizontal direction.
displays the area specified by cursors A and B fully in the horizontal direction.
Clicking ![]() reverts to the previous display before zooming. If there is no history, the area is
reduced to the optimal size.
reverts to the previous display before zooming. If there is no history, the area is
reduced to the optimal size.
Expanding and reducing the Y-axis
Drag the ![]() icon to move the data line up and down.
icon to move the data line up and down.
Right-drag the ![]() icon to move the zoom point. If you select the display resolution when Y axis
setting, expanding or reducing takes place with the zoom point at the center.
icon to move the zoom point. If you select the display resolution when Y axis
setting, expanding or reducing takes place with the zoom point at the center.
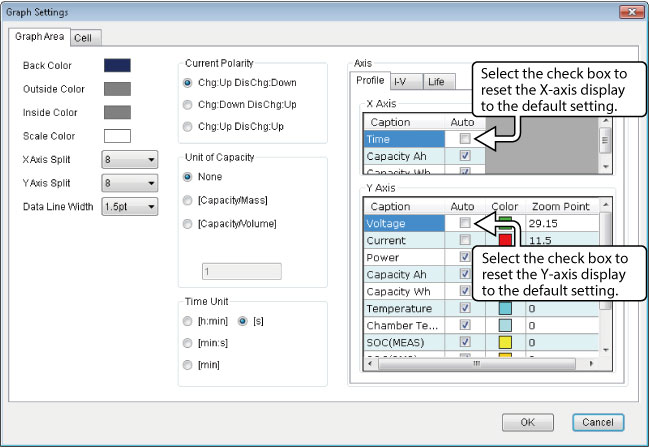
Resetting to the default display
To reset the X-axis and Y-axis zoom display to the default setting, on the Tool menu, click Graph Settings.
If you use cursors A and B to zoom the X-axis, the Auto check box of the X-axis is cleared automatically.
If you change the Y-axis zoom point or zoom the Y-axis, the Auto check box of the Y-axis is cleared automatically, and the zoom point reference value is entered automatically.
Selecting the Auto check box restores the original display.