
Starg Guide
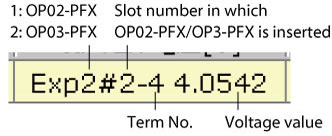
Assigning cell voltages to the option board (OP02-PFX/OP03-PFX)
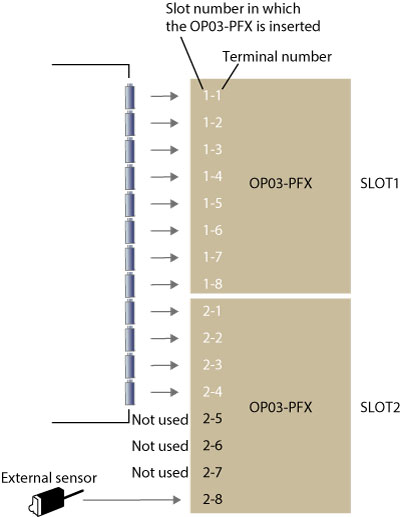
This section explains an example of using two OP03-PFX boards (voltage measurement: 16 terminals) to connect 12 serially connected batteries and one external sensor channel.
| Cell overcharge protection voltage | 4.35 V | |
|---|---|---|
| Cell discharge protection voltage | 3.1 V | |
| External sensor’s alarm transition time | Upper limit | 8.0 V |
| Lower limit | 1.5 V | |
Connection
- Connect the cell voltage sensing cable from each cell of the 12 serially connected batteries to terminals 1-1 to 2-4 of the OP03-PFX option board.
- Connect the external sensor to terminal 2-8.
Setting test conditions using Test Condition Editor
Use the Test Condition Editor to configure protection functions and profiles.
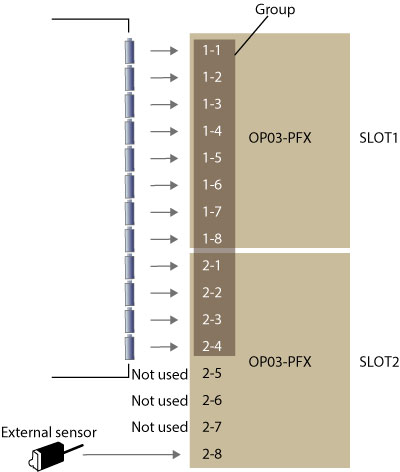
Groups
Assigning the connected cells to groups enables the following functions.
・The maximum cell voltage and minimum cell voltage are displayed in the channel pane and test results of the Test Executive.
・The terminals are subject to cell CV control.
In this example, terminals 1-1 to 2-4 will be assigned to a group. Terminal 2-8 that the external sensor is connected to will be used as alarm criteria voltage.
Setting groups and protection functions
- Start the Test Condition Editor.
- Click
 Or, on the File menu, click New Project.
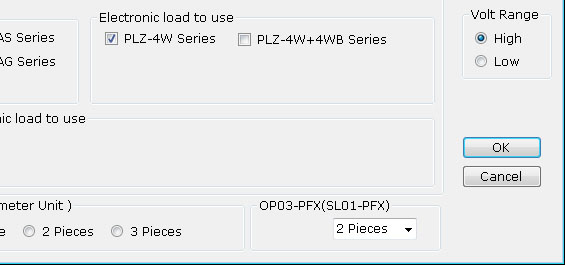
 - Select 2 Pieces for OP03-PFX(SL01-PFX), and click OK.
- Click the Bt Protection and Options tab.
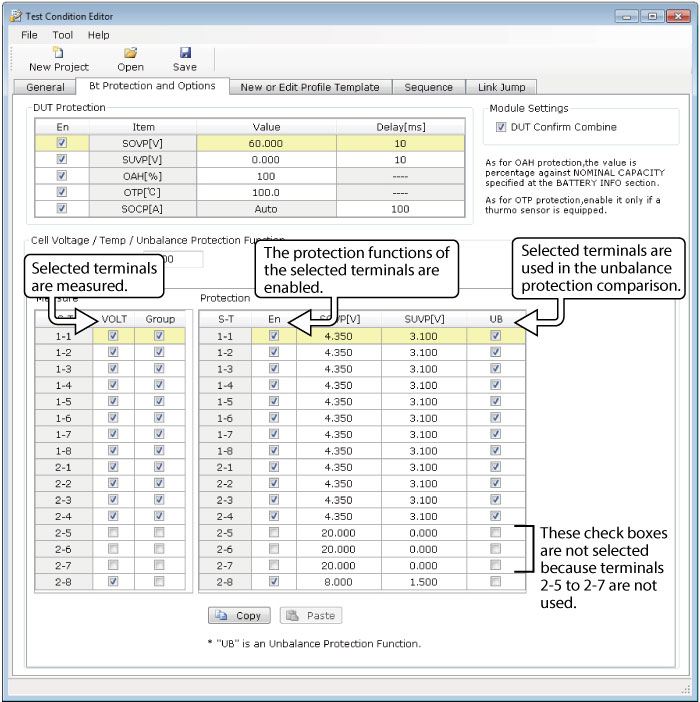
- Refer to the following figure to set the protection function and group for each cell.
Select the model ID of the combination to be used as a power supply module, and select the voltage range to use.
Because the voltages of 1-1 to 2-4 and 2-8 are to be measured, select the VOLT check boxes under Measure.
To include 1-1 to 2-4 in a group, select the Group check boxes under Measure.
To enable the protection functions of 1-1 to 2-4 and 2-8, select the En check boxes under Protection.
Enter 4.35 V in SOVP and 3.1 V in SUVP for 1-1 to 2-4. Enter 8.0 V in SOVP and 1.5 V in SUVP for 2-8.
Select the UB check boxes for 1-1 to 2-4 to include them for unbalance protection comparison.
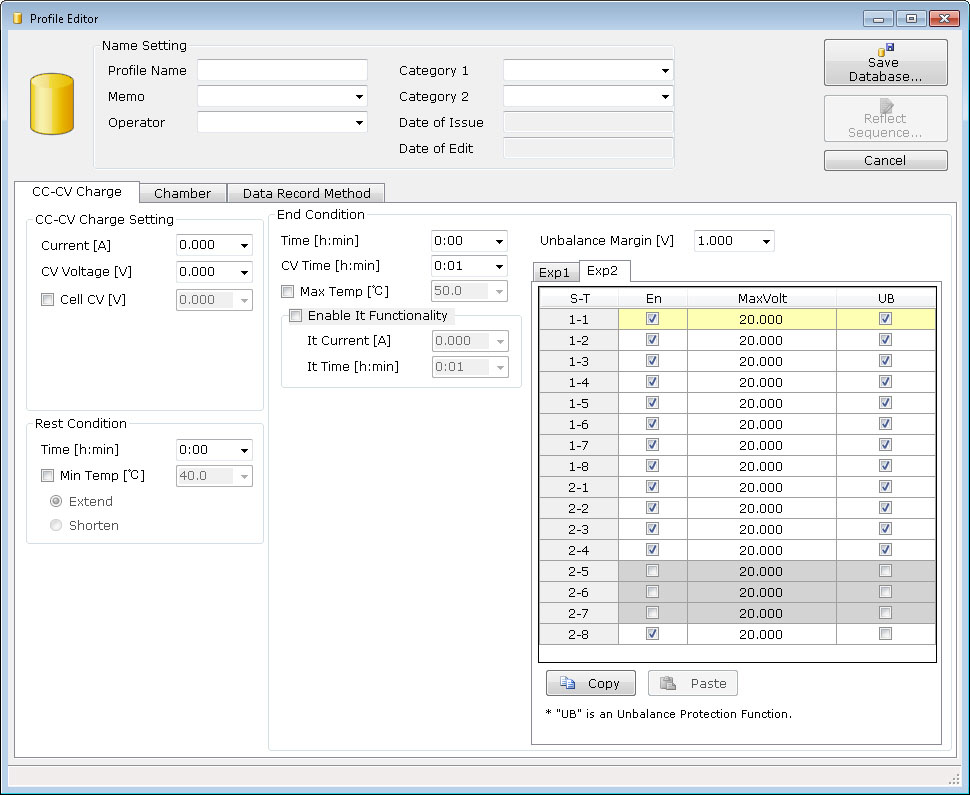
Configuring profiles
If OP03-PFXs are in use, you can set cell voltages as profiles' end conditions.
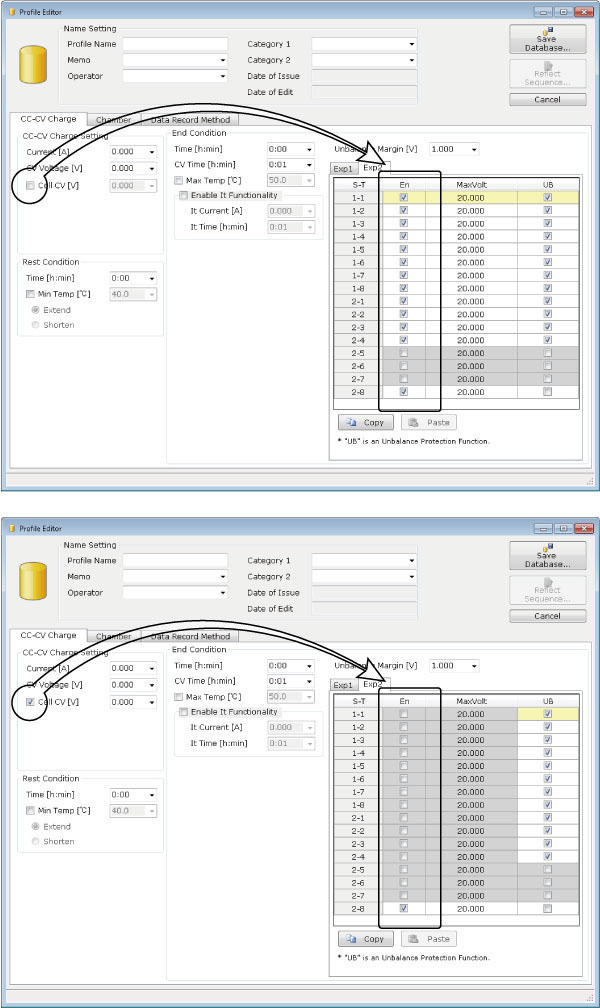
Set the OP03-PFX items on the Exp2 tab. Cells that are not to be measured cannot be set.
Cell CV control and the cell voltage in the end condition cannot be used simultaneously. If Cell CV is enabled, you cannot set the cell voltage in the end condition. Even if the cell voltage is already set, when you enable Cell CV, the cell voltage is disabled.
Cell CV voltages can be set in cell CV charge (CC-CV charge profile), cell CV discharge (CC-CV discharge and CP-CV discharge profiles), and cell CV charge/discharge (pattern profile).
Displaying cell voltages in the Test Executive
While a test is in progress, only the maximum cell voltage and minimum cell voltage can be displayed in the channel pane. To display the cell voltages of all terminals, use the Graph Viewer after data acquisition.
If the maximum cell voltage or minimum cell voltage is not displayed in the channel pane, configure the channel pane display on the monitor setting tab.
- On the Tool menu, click Option and then the Monitor tab.
- In the Hide area, select Max Cell Voltage, and click
 .
. - Likewise, move Min Cell Voltage to the View area.
- Click OK.
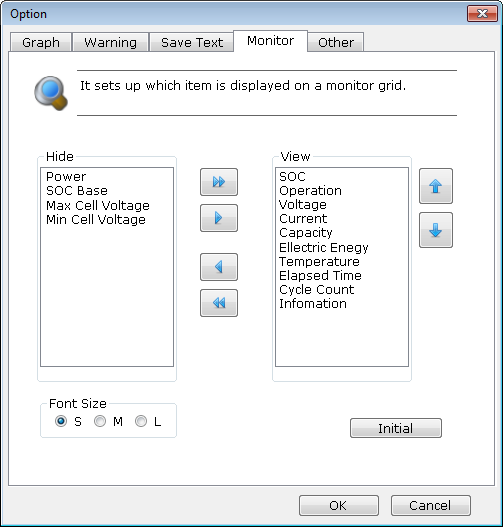
Max Cell Voltage moves to the View area.
You can change the displayed order of items by selecting an item in the View area and clicking ![]() .
.
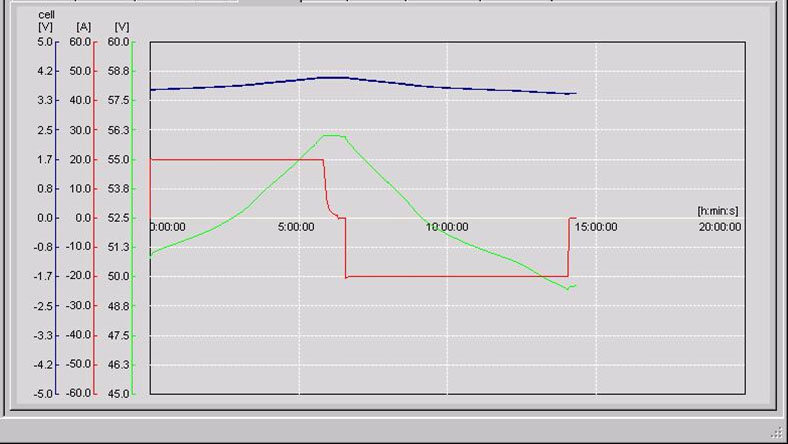
Displaying cell voltage waveforms
- On the Tool menu, click Option and then the Graph tab.
- Select the Cell Volt (Min,Max) check box.
- Enter Y Axis Setting (Min, Max).
- Click OK.
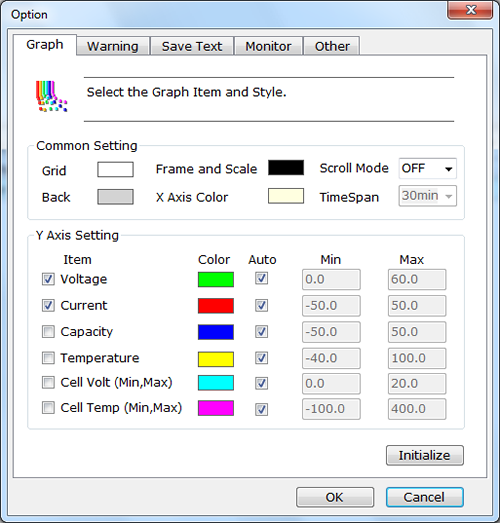
Selecting the Auto check box automatically sets the Y-axis display range.
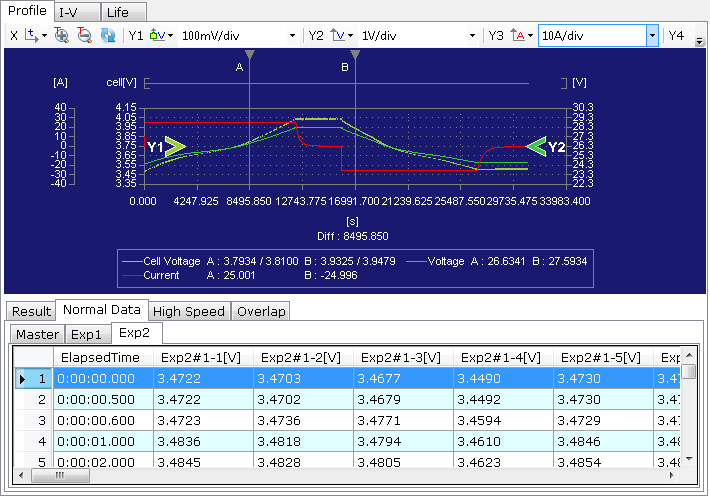
Viewing all cell voltages (Graph Viewer)
You can view all cell voltages in the text area of the graph pane of the Graph Viewer. Cell voltage waveforms can be displayed in the graph area.
- On the Tool menu, click Graph Settings and then the Exp2 tab of the Cell tab. Select the 1-1 to 2-4 check boxes.
- Click OK.
- Select the profile you want to display.
- Set the Y-axis to cell voltage in the graph area.
- In the text area, select the Exp2 tab of the Normal Data tab.

Cell voltage waveforms are displayed.

You can view all the cell voltages.
If you want to view the maximum and minimum cell voltages, on the Tool menu, click Graph Settings and then the Exp2 tab of the Cell tab. Then, select Cell Voltage Min, Max Fill.
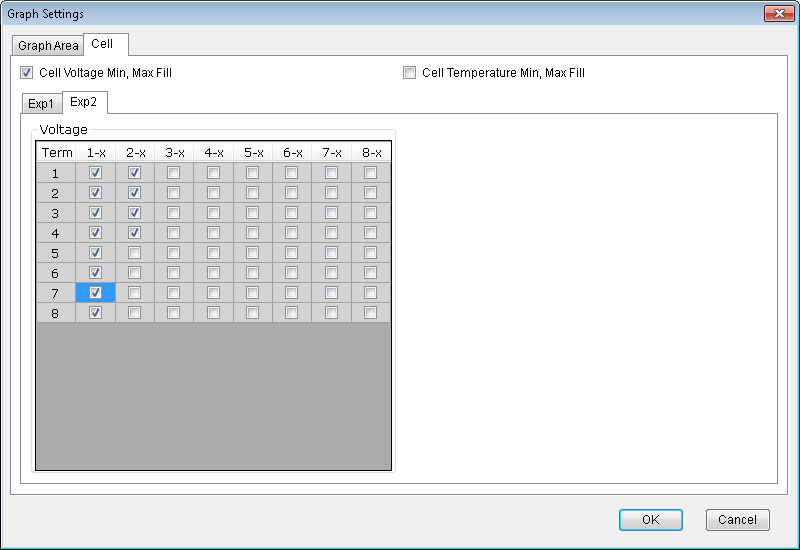
The area between the maximum values and minimum values are filled with a color.
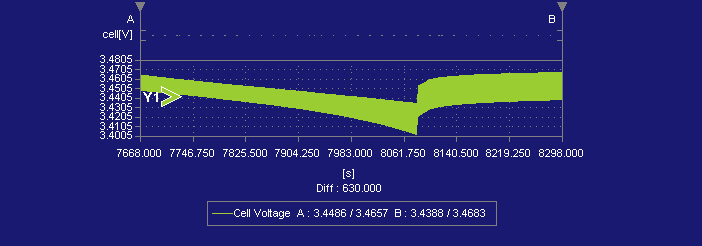
Drawing speed is faster by displaying a filled area rather than displaying the data lines of all cells.